Our numbers below let you see how we’re doing with performance and availability around account information and making payments.
All UK banks have been asked by the regulator to show you this information for Online Banking, Mobile Banking and for Open Banking. Open Banking is the name used by the financial industry to describe new services which let account holders share their financial information and give permission for banks and other authorised organisations to make payments from certain accounts.
Open Banking was introduced by the UK’s Competition and Markets Authority (CMA) to bring more competition and innovation to the financial services industry. It works using a secure system to let you register with other banks or authorised organisations (known as third party providers, or TPPs) and tell your bank to let them see and use your payment account details. For more information you may want to visit the Open Banking website.
Where we show you times in milliseconds, it’s reflecting the extreme speed at which our systems work. Anything less than 1000 MS takes less than a second to happen.
We’ll update this information every quarter. This set of numbers shows performance from 1 April – 31 June. Our next update, for Jul – Sep 2026, will be in Nov 2026.
| Average availability of all our Channels | 99.99% |
|---|
| Average Payments Performance across all Channels | 651 |
|---|
| Average Accounts Performance across all Channels | 306 |
|---|
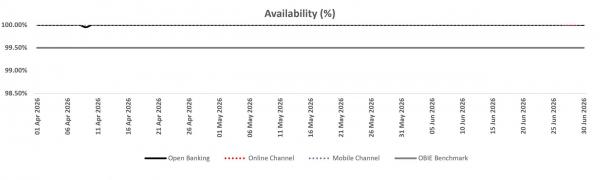
Banking Channels Service Availability – The table below shows the average availability of our 3 customer channels.
| Availability | April | May | June |
|---|---|---|---|
| Online Banking Channel | 100.00% | 100.00% | 100.00% |
| Mobile Banking Channel | 100.00% | 100.00% | 100.00% |
| Open Banking Channel | 99.95% | 100.00% | 100.00% |
| Open Banking Benchmark | 99.5% | 99.5% | 99.5% |
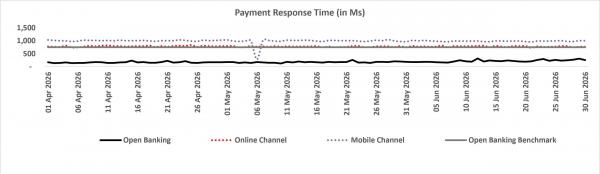
Payment Information – The table below shows the average time taken (in milliseconds) for us to process a payment for you.
| Payment information | April | May | June |
|---|---|---|---|
| Online Banking Channel | 787 | 772 | 777 |
| Mobile Banking Channel | 1,003 | 974 | 984 |
| Open Banking Channel | 165 | 173 | 221 |
| Open Banking Benchmark | 750 | 750 | 750 |
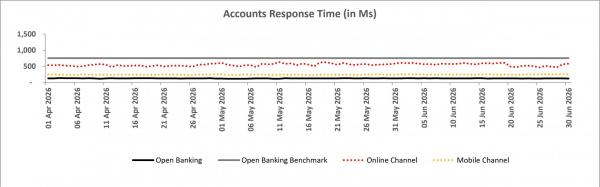
Account Information – The table below shows the average time (in milliseconds) for us to provide you with customer information.
| Account information | April | May | June |
|---|---|---|---|
| Online Banking Channel | 526 | 563 | 557 |
| Mobile Banking Channel | 240 | 239 | 246 |
| Open Banking Channel | 128 | 125 | 127 |
| Open Banking Benchmark | 750 | 750 | 750 |
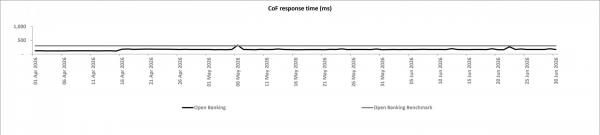
Confirmation of funds – The table below shows the average time taken (in milliseconds) for us to provide you with confirmation that funds are available before initiating a payment.
| Confirmation of funds | April | May | June |
|---|---|---|---|
| Open Banking Channel | 145 | 171 | 172 |
| Open Banking Benchmark | 300 | 300 | 300 |
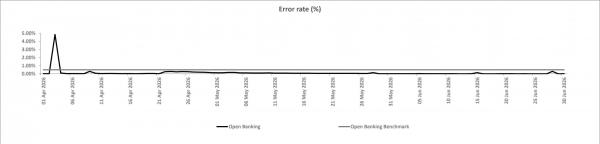
Error rate – The table below shows the number of error messages we received from 3rd party providers, divided by the total number of successful requests we received for the day.
| Error rate | April | May | June |
|---|---|---|---|
| Open Banking channel | 0.26% | 0.08% | 0.02% |
| Open Banking Benchmark | 0.50% | 0.50% | 0.50% |